

Fluorimetry
An analytical technique. Measures the fluorescent light emitted by a sample.
Wavelength of emitted light >> wavelength of absorbed light. The process is called luminescence or cold light (as this particular light is produced at low temperatures).
Physical properties and composition of the sample can be studied by –
- Measuring the intensity
- Measuring the wavelength of emitted fluorescence
Basic principle– emission of light by a substance after absorbing light of a specific wavelength can show us the composition and nature of the substance.
How does it work?
- Light(UV rays) of a specific wavelength falls on a sample.
- The fluorophores (chemical compounds like dyes, biological proteins, or quantum dots, which are added to the sample) absorb the light and get excited.
- Once excited, the fluorophores move to a state of higher energy
- The excited state is highly unstable, so the electron (in the fluorophore) returns to its ground state.
- It releases the excess energy in the form of photons.
- Energy is lost in the process. So, light with lower energy and longer wavelength is emitted from the sample compared to absorbed light.
The light emitted is called fluorescence, and the instrument used to detect this is a fluorimeter. To read more on the working of a fluorescence microscope, check out my previous post.
Colorimetry
An analytical method that detects how much light is transmitted and emitted by a liquid sample.
A colorimeter measures the amount of light that passes through and transmits from a liquid solution. The solute’s (sample) color intensity is compared to the color intensity of a reference solution (blank). This helps us identify the concentration of the solution.
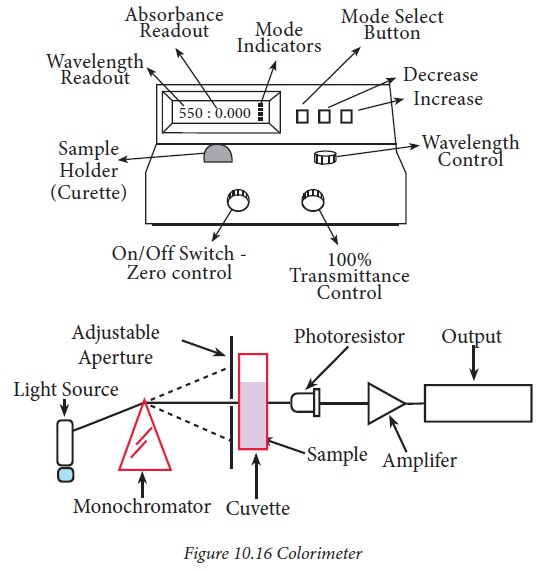
How does a colorimeter work?
A colorimeter has 3 main components. As seen in the given figure, incident light from a light source passes through a monochromator, which allows only light of a specific wavelength (say 600 nm) to pass through. The specific monochromatic light reaches the sample placed in a cuvette. By comparing the color intensity between the sample and a reference sample, one can calculate the absorbance of the light and the concentration of the solution. Finally, the photo receptor converts light energy to electrical energy. The reading is then amplified by an amplifier before it shows up on the colorimeter.
After analysis, the transmittance and concentration of the tested specimen are plotted on a graph to obtain a graphical representation of the concentration, creating a calibration curve.
Since the process involves comparing color intensities, several solutions of known concentrations are required in order to find the concentration of an unknown sample.
When an incident light I falls on a sample solution, the light can take three paths- it is either
- Reflected (Ir)
- Absorbed (Ia)
- Transmitted (It)
The operation of a colorimeter is based on Beer-Lambert’s law, which states that the amount of light absorbed by a color solution is directly proportional to the solution’s concentration and the length of a light path through it.
A ∝ cl
A = ∈cl
A stands for absorbance or optical density of the solution
∈ stands for the coefficient of absorption
C stands for the concentration of the solution and
L stands for the length of the path
Colorimetry is immensely useful in quantitative analysis, especially when the solution is colored. But here’s a catch. It works only with incident light from the visible range (400-700 nm).
Spectrophotometry
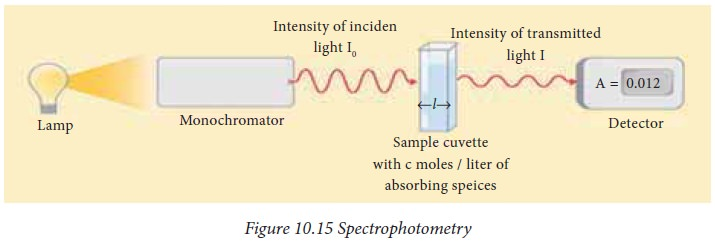
It is an analytical technique that quantifies the concentration of a substance by measuring the amount of light it absorbs or transmits at a specific wavelength.
Since different substances have unique light absorption properties, this technique can identify and measure the concentration of known compounds in unknown solutions.
Why is it better than Colorimetry?
While both samples absorb light, Spectrophotometry works for both colored and colorless solutions. Not just that, they work with a wide range of light wavelengths, including UV, visible, and infrared (200-1000 nm).
Working principle– Spectrophotometry, just like Colorimetry, works on the same principle, i.e., Beer-Lambert’s law. It is just a broader and more advanced version of Colorimetry.
Classification
Since they can absorb light from a wide range of wavelengths, they are classified into 3 types: UV, Visible, and IR spectroscopy.
UV spec
Wavelength range– 200-400 nm
Light source– Deuterium lamp or hydrogen lamp
It measures electronic transitions– i.e., movement of electrons between different orbitals.
It is usually used for colorless solutions, DNA, RNA, Proteins(260-280 nm), and aromatic compounds.
Visible spectroscopy
Wavelength– 400-700 nm
Light source– tungsten lamp
It measures electronic transitions, but only those producing visible color
It is usually used for detecting colored products like glucose using the DNS method and proteins using the biuret method.
Infra-red Spectroscopy
Wavelength range– 700 nm to 25000 nm
Light source– silicon carbide
It measures vibrational transitions and not electronic. It means it measures the stretching and bending of chemical bonds.
This is used to identify functional groups and study molecular structure. So, in contrast to UV and Visible Spectrophotometry, it is involved in structural identification more than quantification.
Absorption and emission spectroscopy
The three types of spectroscopy (UV, visible, and IR) you looked at previously may have different specifications and applications. But, they have one thing in common- they measure the amount of incoming light absorbed by the sample. Hence, they fall under absorption spectroscopy. This consists of dark lines in the spectrum.
There is yet another branch of spectroscopy- emission spectroscopy. It measures the light emitted by atoms that were excited by energy like light or heat. This technique gives you more details, like elemental composition and energy transitions. Fluorescence studies fall under this category. This comprises colored lights in the spectrum.
Thanks for sharing!